Observability for AI Agent Database Query Pipelines
Agents fail silently in ways traditional monitoring can't catch.
Picture a customer staring at an invoice that tripled overnight, with no price change, no new usage, nothing in their account history to explain it. Support pulls up the dashboard. Everything is green. The agent that generated the billing summary returned a 200, answered confidently, and moved on to the next request. That is the failure this piece is about: agents that fail quietly, in ways a pass/fail check will never catch, because the response looks fine even when the reasoning behind it was wrong. Traditional application monitoring was built for a different kind of system: one where the same input produces the same output through the same code path, and an HTTP error is the signal that something broke. Agents break every one of those assumptions, since they're non-deterministic by design, and a dashboard that shows "service up" tells you nothing about whether the agent picked the right tool, passed the right arguments, pulled the right memory, or stayed on the plan it was given. An agent can loop twice on the same step, call the wrong tool, invent a billing policy that doesn't exist, or retry a failed call five times in a row, and still hand back an answer with total confidence and a clean status code. The usual defense is "we already have logs," but application logs record whatever events a developer thought to log. They don't capture the reasoning that led to a decision, so a log line can't show you that the agent drifted off its plan, picked the wrong branch, or read a stale memory entry as if it were current.
Agents don't query databases the way people do, and that difference is what has to drive the design of any instrumentation built for them. A person runs a query to get an answer and stops. An agent probes, re-ranks results, retries when something looks off, and branches down a different path based on what the last query returned. Query behavior shifted along with the interface: people work through a screen, applications work through fixed CRUD calls, but agents work through tool calling, where retrieval, query generation, and any action the agent is allowed to take all happen through function-call endpoints. That means every query is also an argument-passing event, and both halves need to show up in the trace, not just the result. Retrieval itself has gotten more layered too: instead of firing off a single query and taking what comes back, agents combine keyword search, hybrid search, dense vector lookups, and graph traversal, often re-ranking and critiquing their own intermediate results before deciding what to do next. Volume adds another wrinkle. Agent-driven query traffic is growing fast, and it's climbing faster than human traffic, month over month. Any aggregate metric tuned for human usage patterns will smooth right over the exact anomalies a team needs to catch. Memory compounds the whole picture: an agent typically carries short-term state for the current thread alongside long-term episodic, semantic, and procedural memory, so one user request can set off a chain of reads and writes across several memory stores at once, each one a place something can go quietly wrong.
The four span types that a minimum viable agent trace schema must capture
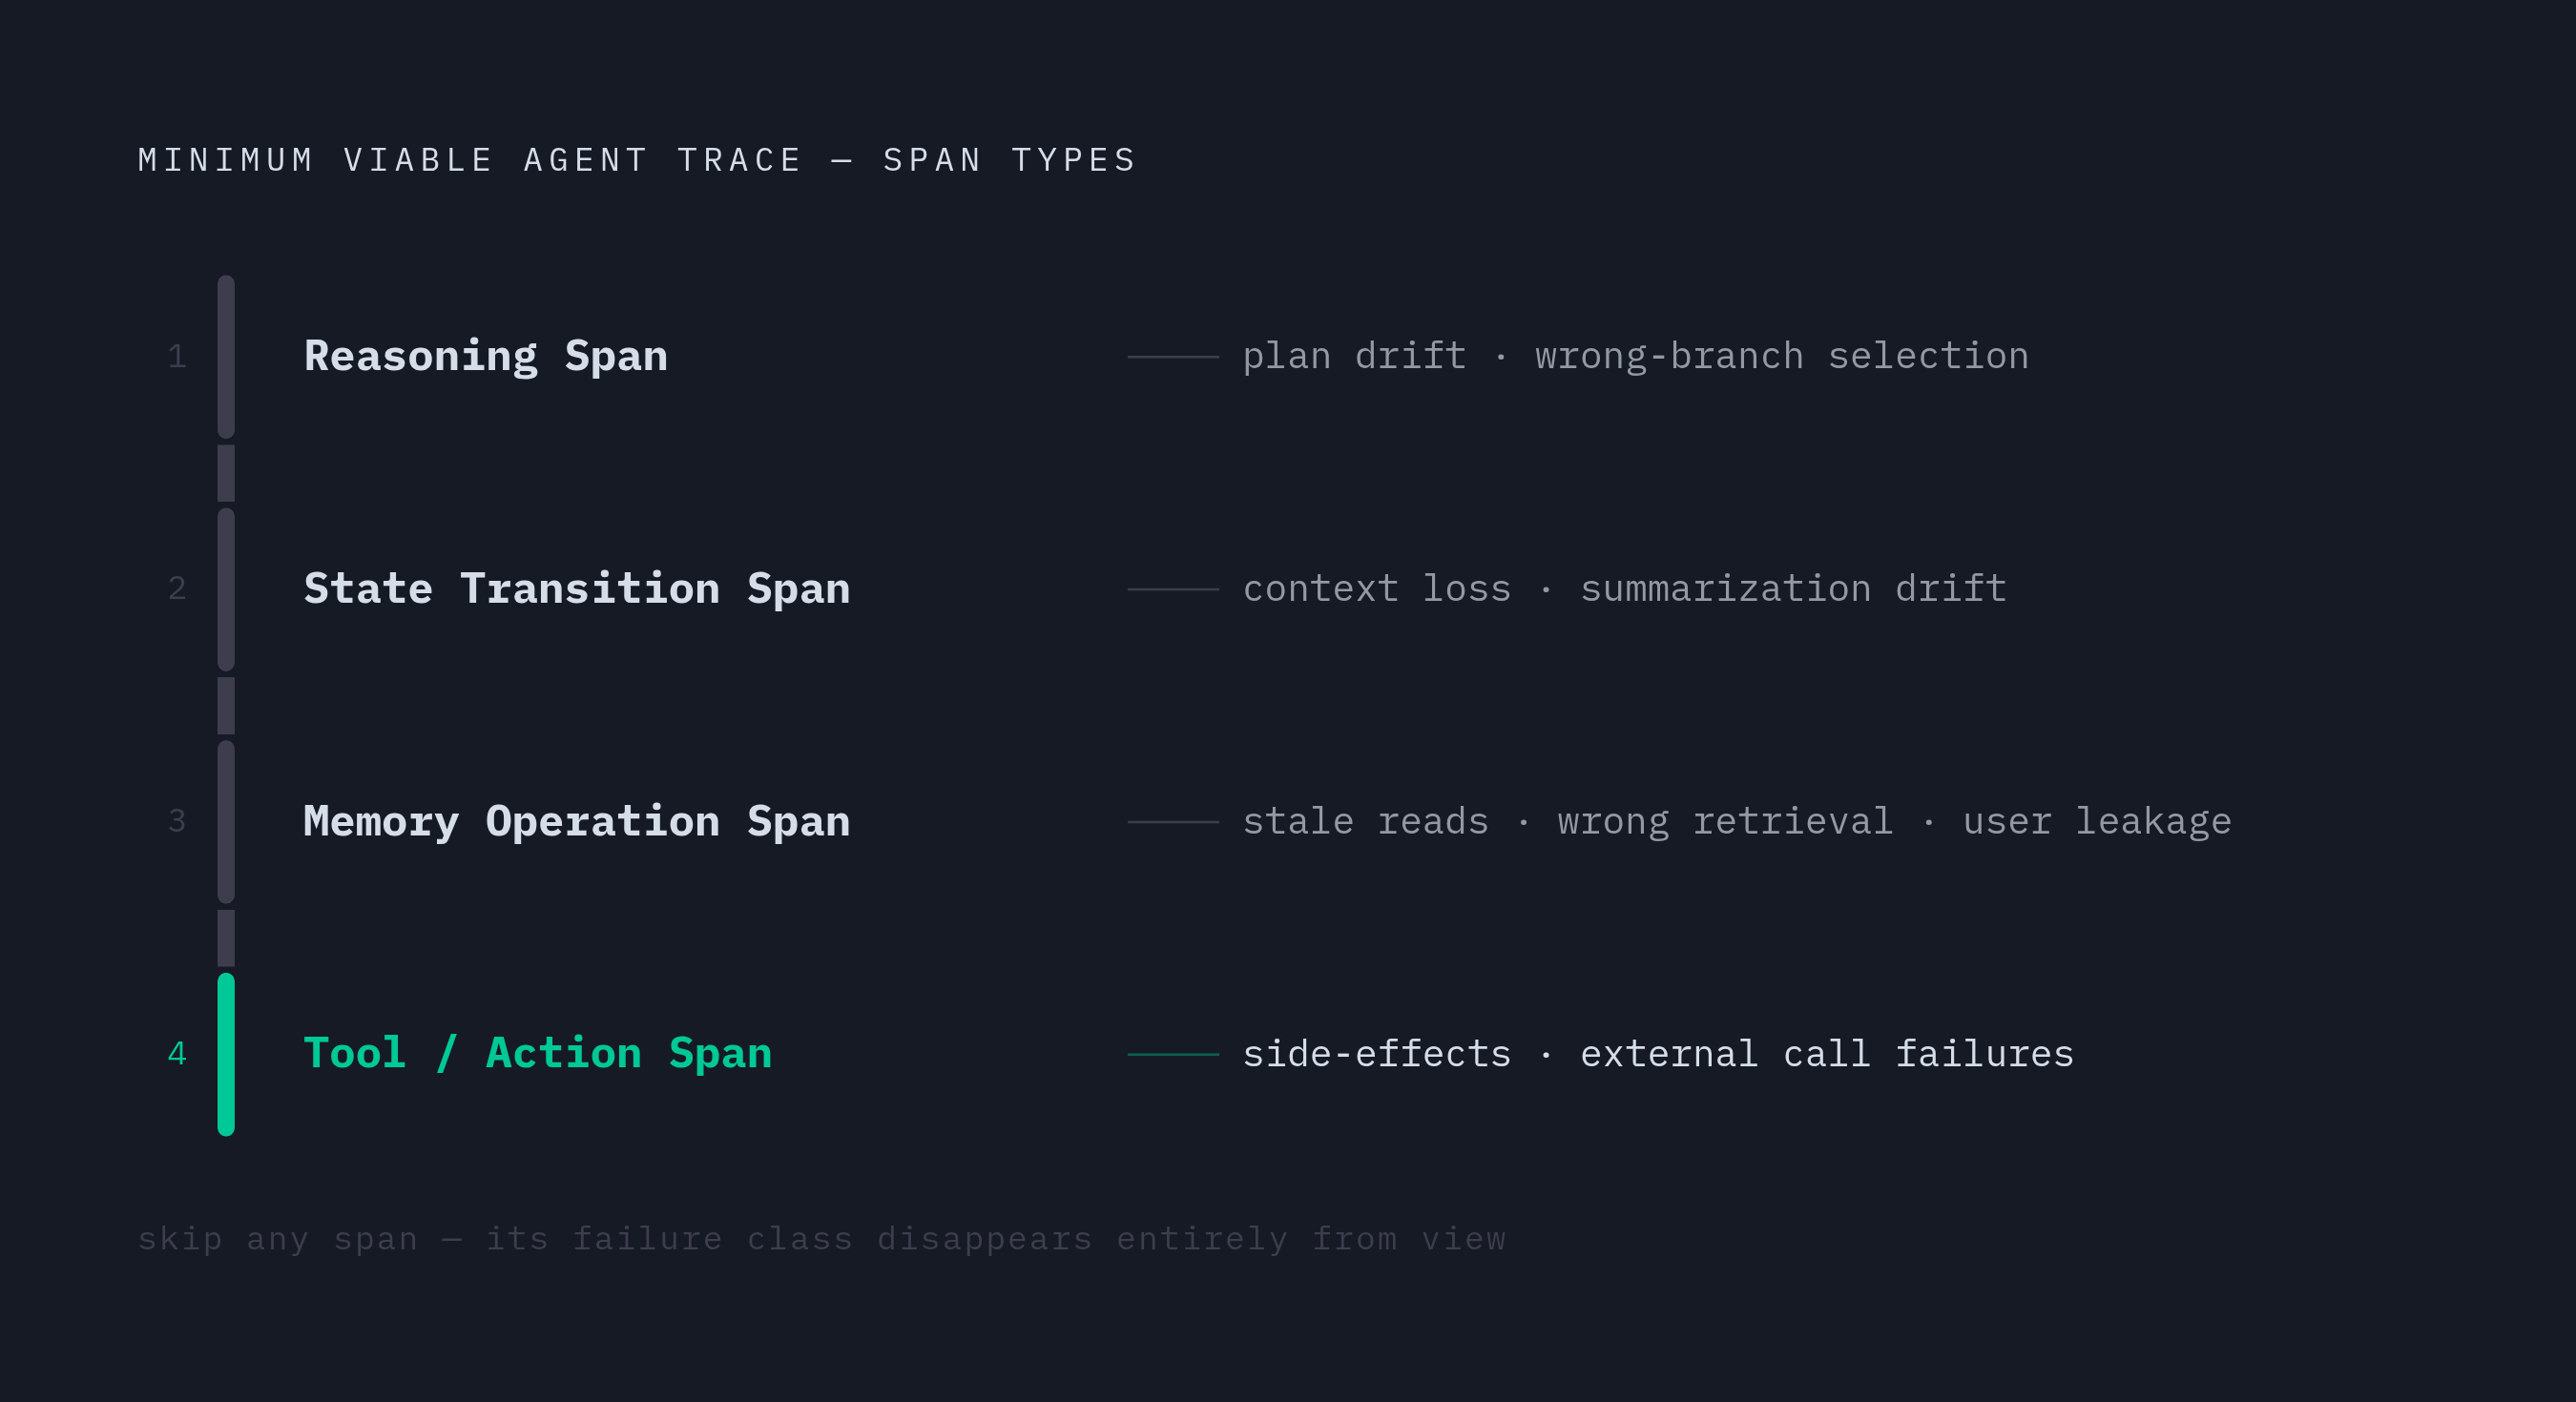
Every distinct way an agent fails has a corresponding place it appears in a trace, and a schema that skips one of those places is a schema with a built-in blind spot. The first is the reasoning span: the plan the model formed, the action it picked, what it observed afterward, and what it decided to do next. Plan drift and wrong-branch selection become visible only in this span, because a single LLM call span just shows an input and an output, not the decision chain between them. The second is the state transition span: working memory before and after each step, any edits to context, and the payload handed off between steps. Context loss and the slow drift that comes from repeated summarization appear here, usually in runs that go on long enough for small errors to compound. The third is the memory operation span: every read and write to a long-term store, the query that was issued, what came back, how relevant it was scored, and how fresh it was. This is where stale reads, retrieval of the wrong entity, and memory leakage between users get caught, assuming someone is looking. Each of these spans needs a type, a timestamp, and a parent-child link back to the rest of the run, so that a single trace reconstructs the entire execution graph for one request. At minimum, every span needs to record its own type, the structured inputs it received, the raw return values or retrieved entries it produced, start time, end time, duration, a typed error state, a retry count, parent retry context, and the identifiers that tie it to the rest of the system: trace ID, parent span ID, session ID, and user or tenant ID. None of this is extra scaffolding bolted on for thoroughness. Each of the four span types is the only place a specific class of failure becomes visible, so leaving one out erases that failure class from view.
What instrumentation belongs at the database layer
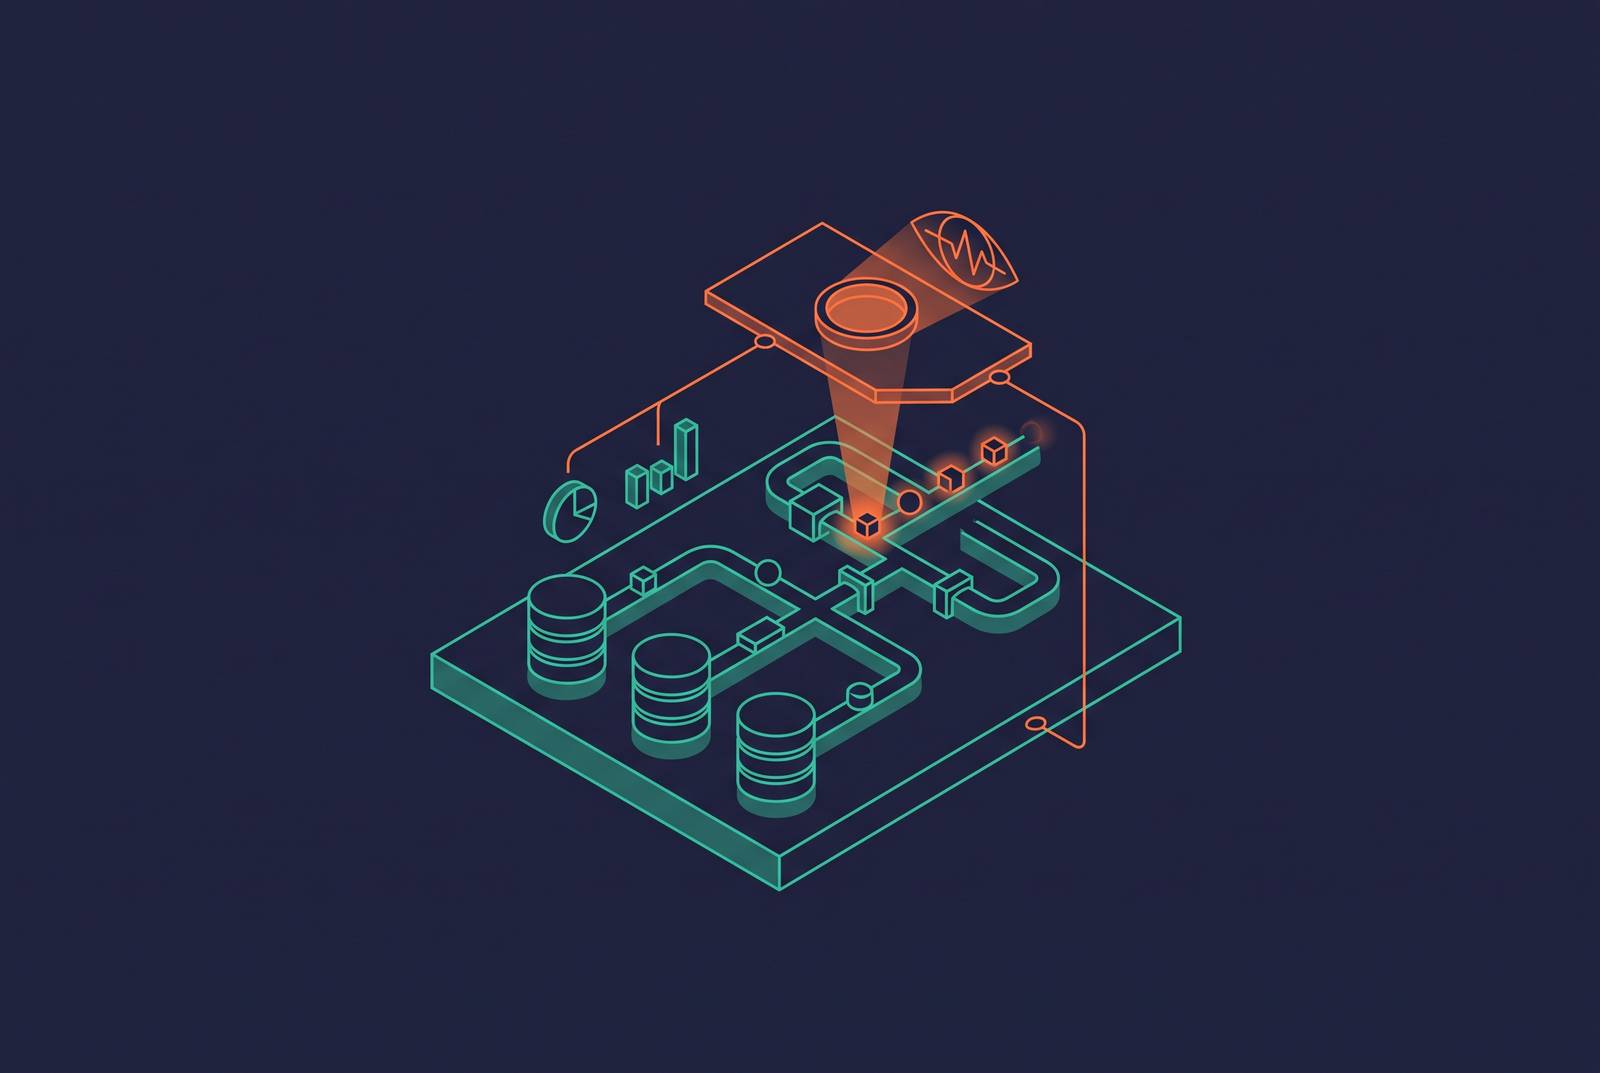
Application-layer traces tell you what the agent meant to do. Only the database layer records what actually ran against real data, and the space between those two is exactly where governance failures and unexplainable bugs tend to live. An agent that queries a deprecated dataset, or pulls from a column it was never authorized to touch, creates a governance problem that stays completely invisible unless the trace reaches all the way down to the data layer. This points to a real gap between the two kinds of tooling teams already have. LLM observability tools stop at prompts, tokens, and latency: they can tell you something broke, but not why, because they were never built with the data and governance context the agent was actually operating inside. Data observability tools have the opposite problem. They're built to track pipeline freshness, data volume, and schema integrity, not the behavior of an autonomous agent moving across those systems on its own. The underlying principle is straightforward: you cannot govern what you cannot observe. Without a decision trace that connects all the way to the data layer, answering "why did the agent do that?" turns into guesswork. What database-layer capture actually needs to record is specific: which query ran, against which schema version, under which agent's identity, at what time, with what row-level filters applied, and whether the query touched any data covered by an active governance policy. None of this is a nice-to-have bolted on after the fact. Agents act on their own and move fast, so the audit log is frequently the only record anyone has of what changed and why, and that record has to live at the database layer rather than get reconstructed later from scraps of application log.
Metrics to track continuously versus what requires trace-level inspection
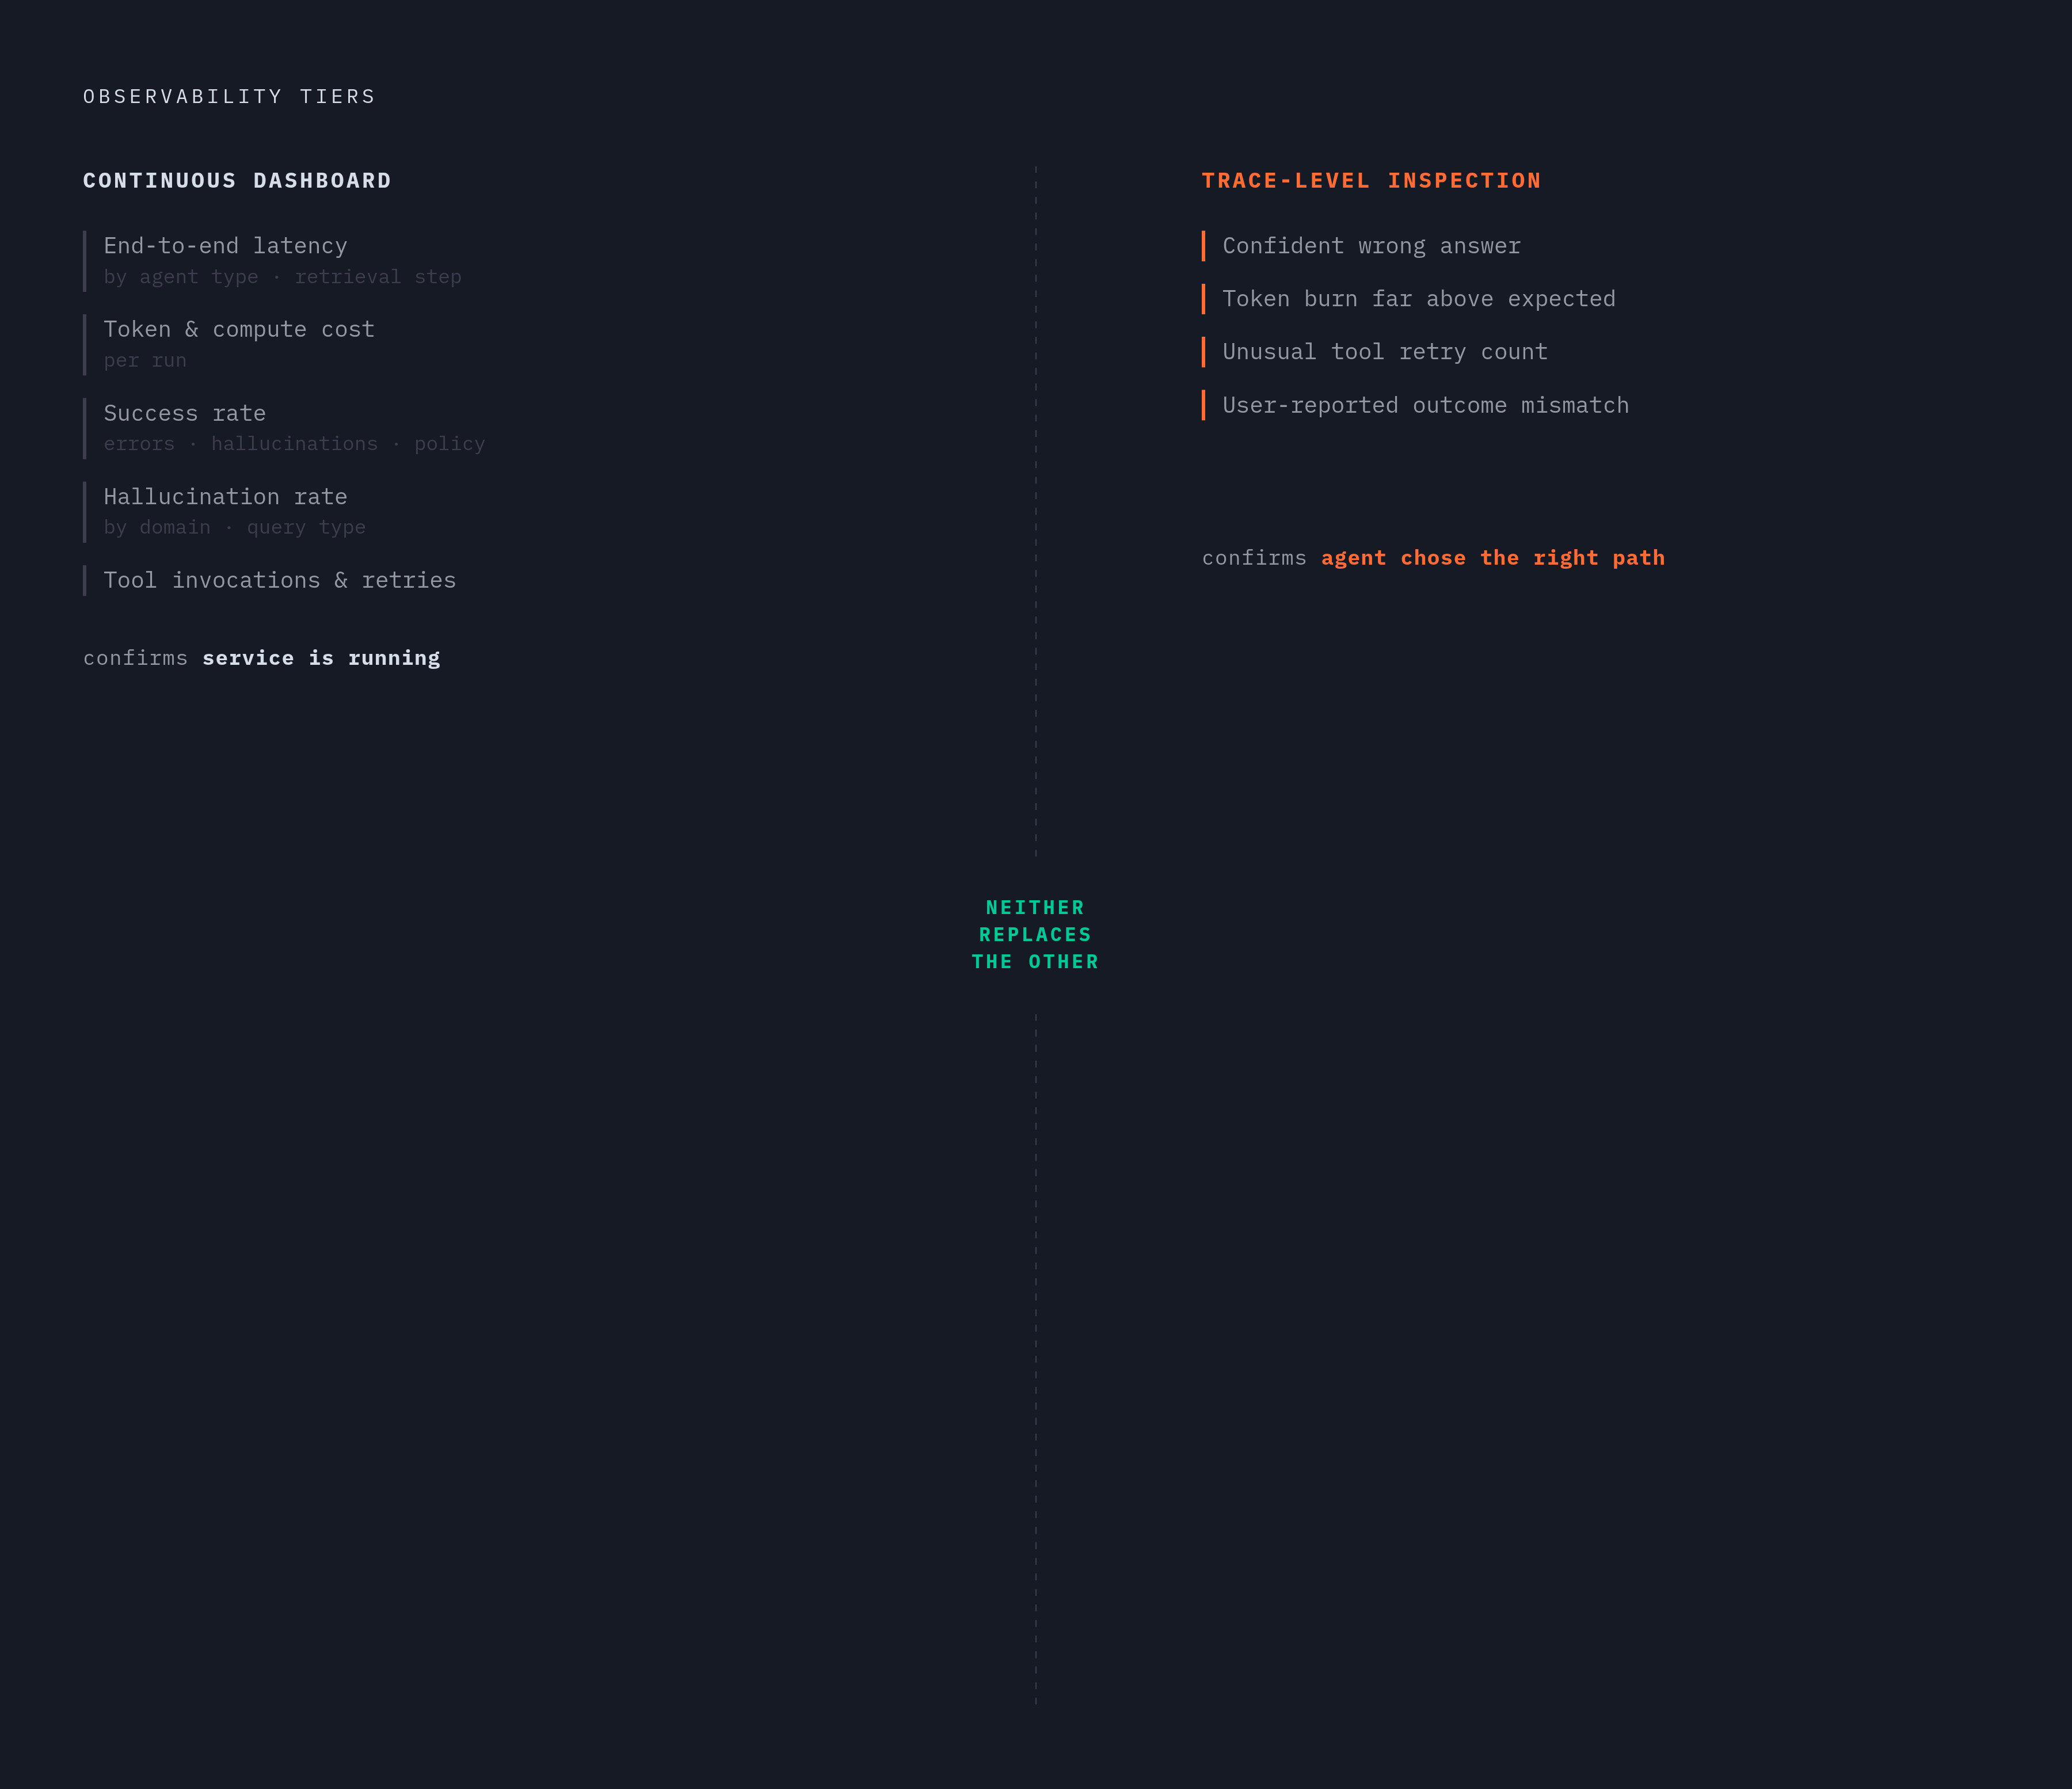
Dashboards and traces answer two different questions, and mixing them up is how a team ends up with a dashboard that looks fine while agents are failing in production. A handful of metrics belong on a continuous monitor: end-to-end latency for each agent run and each sub-task, broken out by agent type, tool used, and retrieval step, since a slowdown buried inside one sub-task is invisible in an overall average. Token consumption and compute cost per run are tracked by agent type and use case, because cost that creeps up in one specific workflow is easy to miss in a blended total. Success rate, the share of runs that complete without errors, hallucinations, or policy violations, works as a top-line health check. Hallucination rate, the frequency with which an agent's output contains claims that aren't grounded in anything it actually retrieved, should be tracked by domain and query type, since some domains invite more confident invention than others. Tool invocation patterns round this out: which tools get called most, which ones carry high retry rates, and which ones return shapes nobody expected. None of these metrics, on their own, tell you whether a specific run went wrong for the right reasons, and that's where trace-level inspection takes over. A trace is pulled when an agent returned a confident wrong answer, when a run burned through far more tokens than the task should have needed, when a tool got retried an unusual number of times, or when a user reports an outcome that doesn't match what the data actually says. Metrics confirm the agent service is running. Traces confirm the agent picked the right tool, passed the right arguments, and stayed on plan, and one can't substitute for the other. Pricing models play into this too: per-query pricing effectively charges more the more an agent explores, which punishes exactly the kind of iterative behavior agents are built to do, while compute-capacity pricing keeps cost per run bounded and makes a genuine cost anomaly far easier to spot.
How MCP changes instrumentation requirements for agent-to-database connections
MCP has become the standard way agents connect to tools, and that shift is opening up instrumentation gaps that most existing observability stacks haven't caught up to yet. As MCP adoption spreads, agents increasingly reach databases through MCP servers instead of calling a database SDK directly, which changes where a query actually originates and how its arguments get passed along the way. That has a direct consequence for tracing: MCP tool calls need to be traced at the protocol level, not just wherever the application happens to log something, because the arguments passed through an MCP server to a database query endpoint are the actual instrument of what the agent did, and they belong in the trace. This protocol layer also opens real security exposure at the database tier. Researchers have flagged malicious code execution, remote access control, credential theft, and weak authentication and authorization as live concerns with MCP implementations, and these are database-layer risks, not just API-layer ones. Catching them requires logging at the database layer too. There's a performance cost too: some implementations inject every connected server's full JSON-Schema into the system prompt at once, and for an agent working across several databases, that can mean a schema payload heavy enough to inflate token cost and drag down retrieval quality. Structured MCP commands let an agent describe, validate, and deploy schema and pipeline changes as code. That workflow produces its own artifact, a schema operation log, that should sit alongside query traces. None of this should read as a settled problem. The official MCP roadmap lists structured audit trails and observability as a priority area for enterprise readiness, without committing to a firm delivery date, so this is a requirement still taking shape.
Sandboxed agent access as an instrumentation design decision, not just a safety feature
Most teams reach for sandboxing because it's the responsible thing to do, a guardrail against an agent touching something it shouldn't. That's true, but it undersells what isolation actually buys an observability program. Giving agents isolated, read-only compute over shared data is also what makes it possible to produce an audit trail that's complete and attributable at the level of an individual query. Without that isolation, agent queries and human queries run through the same execution context, so a trace can't reliably say which query came from which agent run, session, or user, and the resulting audit log ends up too weak to hold up under real scrutiny. Each agent gets its own isolated compute, so every query carries a clear identity from the start: which agent issued it, which session it belongs to, which task it was serving. The trace and the audit log line up structurally instead of needing to be stitched together after the fact through correlation guesses. Isolation also changes how enforceable a policy actually is. An agent working without shared, governed context about the data, rules, and policies around it will produce hallucinated or harmful output even when the underlying model is perfectly capable; isolation is what lets a policy get enforced right at the query boundary. The same logic applies to experimentation. An agent running experimental queries against production data without isolation can trigger side effects that stay invisible until some downstream system reflects them back, while a branched environment with full query logging turns that same experiment into something auditable and reversible if it goes wrong.
Building the evaluation loop: turning production traces into a continuous quality signal
Collecting traces is only the first half of the job. They only pay off operationally once they feed back into an evaluation pipeline that catches a regression before it compounds into something worse, since observability without that feedback loop is just logging with nowhere to go. A full stack needs an evaluation layer that scores production traces and routes failures back into the evaluation suite, so the same class of failure doesn't ship a second time once it's already been caught once. For database query pipelines specifically, evaluation needs to check concrete things: did the agent query the right table or the right schema version, did the rows it retrieved actually match what the query intended to ask, and did the agent state a value that contradicts what the database itself returned. Using an LLM as a judge against live traffic is a practical way to score retrieval quality and tool-call correctness at the volume production actually runs at, without requiring a human to read every single trace by hand. The last piece ties the loop to deployment itself: when evaluation scores drop below a set threshold, that should block the new agent version from shipping, the same way a failing test suite blocks a bad code change, with the agent's behavior as the thing under test.