Distributed Traces Definition and Data Structure for Storage Systems
Structure spans as columnar records to cut storage costs and speed trace queries.
Distributed traces have a precise data structure, and that structure determines how they should be stored. Trace IDs, spans, parent-child relationships, and propagated context shape both the incoming data and the questions asked of it. Fast, affordable trace storage comes from aligning the schema, storage architecture, and access model with those properties, rather than treating spans as ordinary database records.
What a distributed trace actually is and what it contains
Distributed tracing tracks a request as it travels through multiple services in a distributed system. A trace ID uniquely identifies that request, and every span belonging to the trace shares it. A span is a time-stamped segment of work with its own span ID. Its parent_span_id points to the span that caused it, allowing the stored records to recreate the request’s causal chain. Together, these identifiers describe both membership in a trace and relationships within it.
A span records an operation name, start and end timestamps, span kind, status, attributes, events, and links. A canonical production storage schema brings these into fields including trace_id, span_id, parent_span_id, service, operation, start_time, end_time, status, and attributes. This storage representation is not identical to the underlying telemetry model, where service identity belongs to resource metadata. For an e-commerce request, Service A handles authentication, Service B handles payment, Service C handles inventory, and Service D handles order confirmation. Each creates a span with the same trace ID, and parent-child links show the order of the calls.
Context propagation carries trace IDs and span IDs through HTTP headers, gRPC metadata, or messaging queue headers. Without that transfer, a downstream service cannot preserve the parent-child chain. The resulting records no longer describe the complete request.
How OpenTelemetry extended the span schema and why that extension matters for storage
OpenTelemetry’s vendor-neutral model brings tracing, metrics, and logs into a common framework. For trace storage, its importance lies in the context surrounding each span alongside the identifiers and timestamps. Resource attributes describe the emitting entity through fields such as service.name, k8s.pod.name, and host.name. Those values repeat on every span from that entity. Scope adds the instrumentation library’s name and version, tying the span to the code that generated it.
The more variable material comes from attributes and events. Attributes are arbitrary key-value pairs such as http.method, db.system, and user.id, and OTEL_SPAN_ATTRIBUTE_COUNT_LIMIT sets how many there can be. Events are timestamped occurrences within a span, effectively attaching logs to the trace. Although attributes and events already appear in the canonical span description, their open-ended contents require much more storage than a fixed field list suggests. Production spans often have dozens of attributes, and attribute columns can take up most of a span’s stored block size.
This creates a tension between diagnostic richness and storage regularity. Metrics show that something is wrong, traces show where, and logs explain why. By attaching events to spans, the model brings some of that explanatory material directly into trace storage.
Why trace data's write pattern is unlike most database workloads
That variable payload arrives in a continuous, high-volume stream. Once spans are written, they are not updated, so the workload is insert-only rather than a mixture of reads, inserts, and updates. Yet append-only does not mean that delayed access is acceptable. Spans must become queryable within seconds of ingestion for real-time root-cause analysis.
The volume follows from how work divides into spans. A request touching four services produces at least four spans, with further child spans for database calls, cache lookups, and downstream APIs. A single high-traffic service can therefore emit millions of spans per minute. Sampling reduces what reaches storage, but the remaining stream still has the same append-only shape. Storage must be designed for the multiplication of user requests into spans.
Reads have a different shape from writes. A common question asks for error spans from the payment service within the last hour, scanning many records but inspecting only a few fields. Time-range scans and aggregations dominate. That combination favors columnar, append-optimized engines over row-oriented relational layouts built for more general workloads.
How the span schema translates into concrete column layout decisions
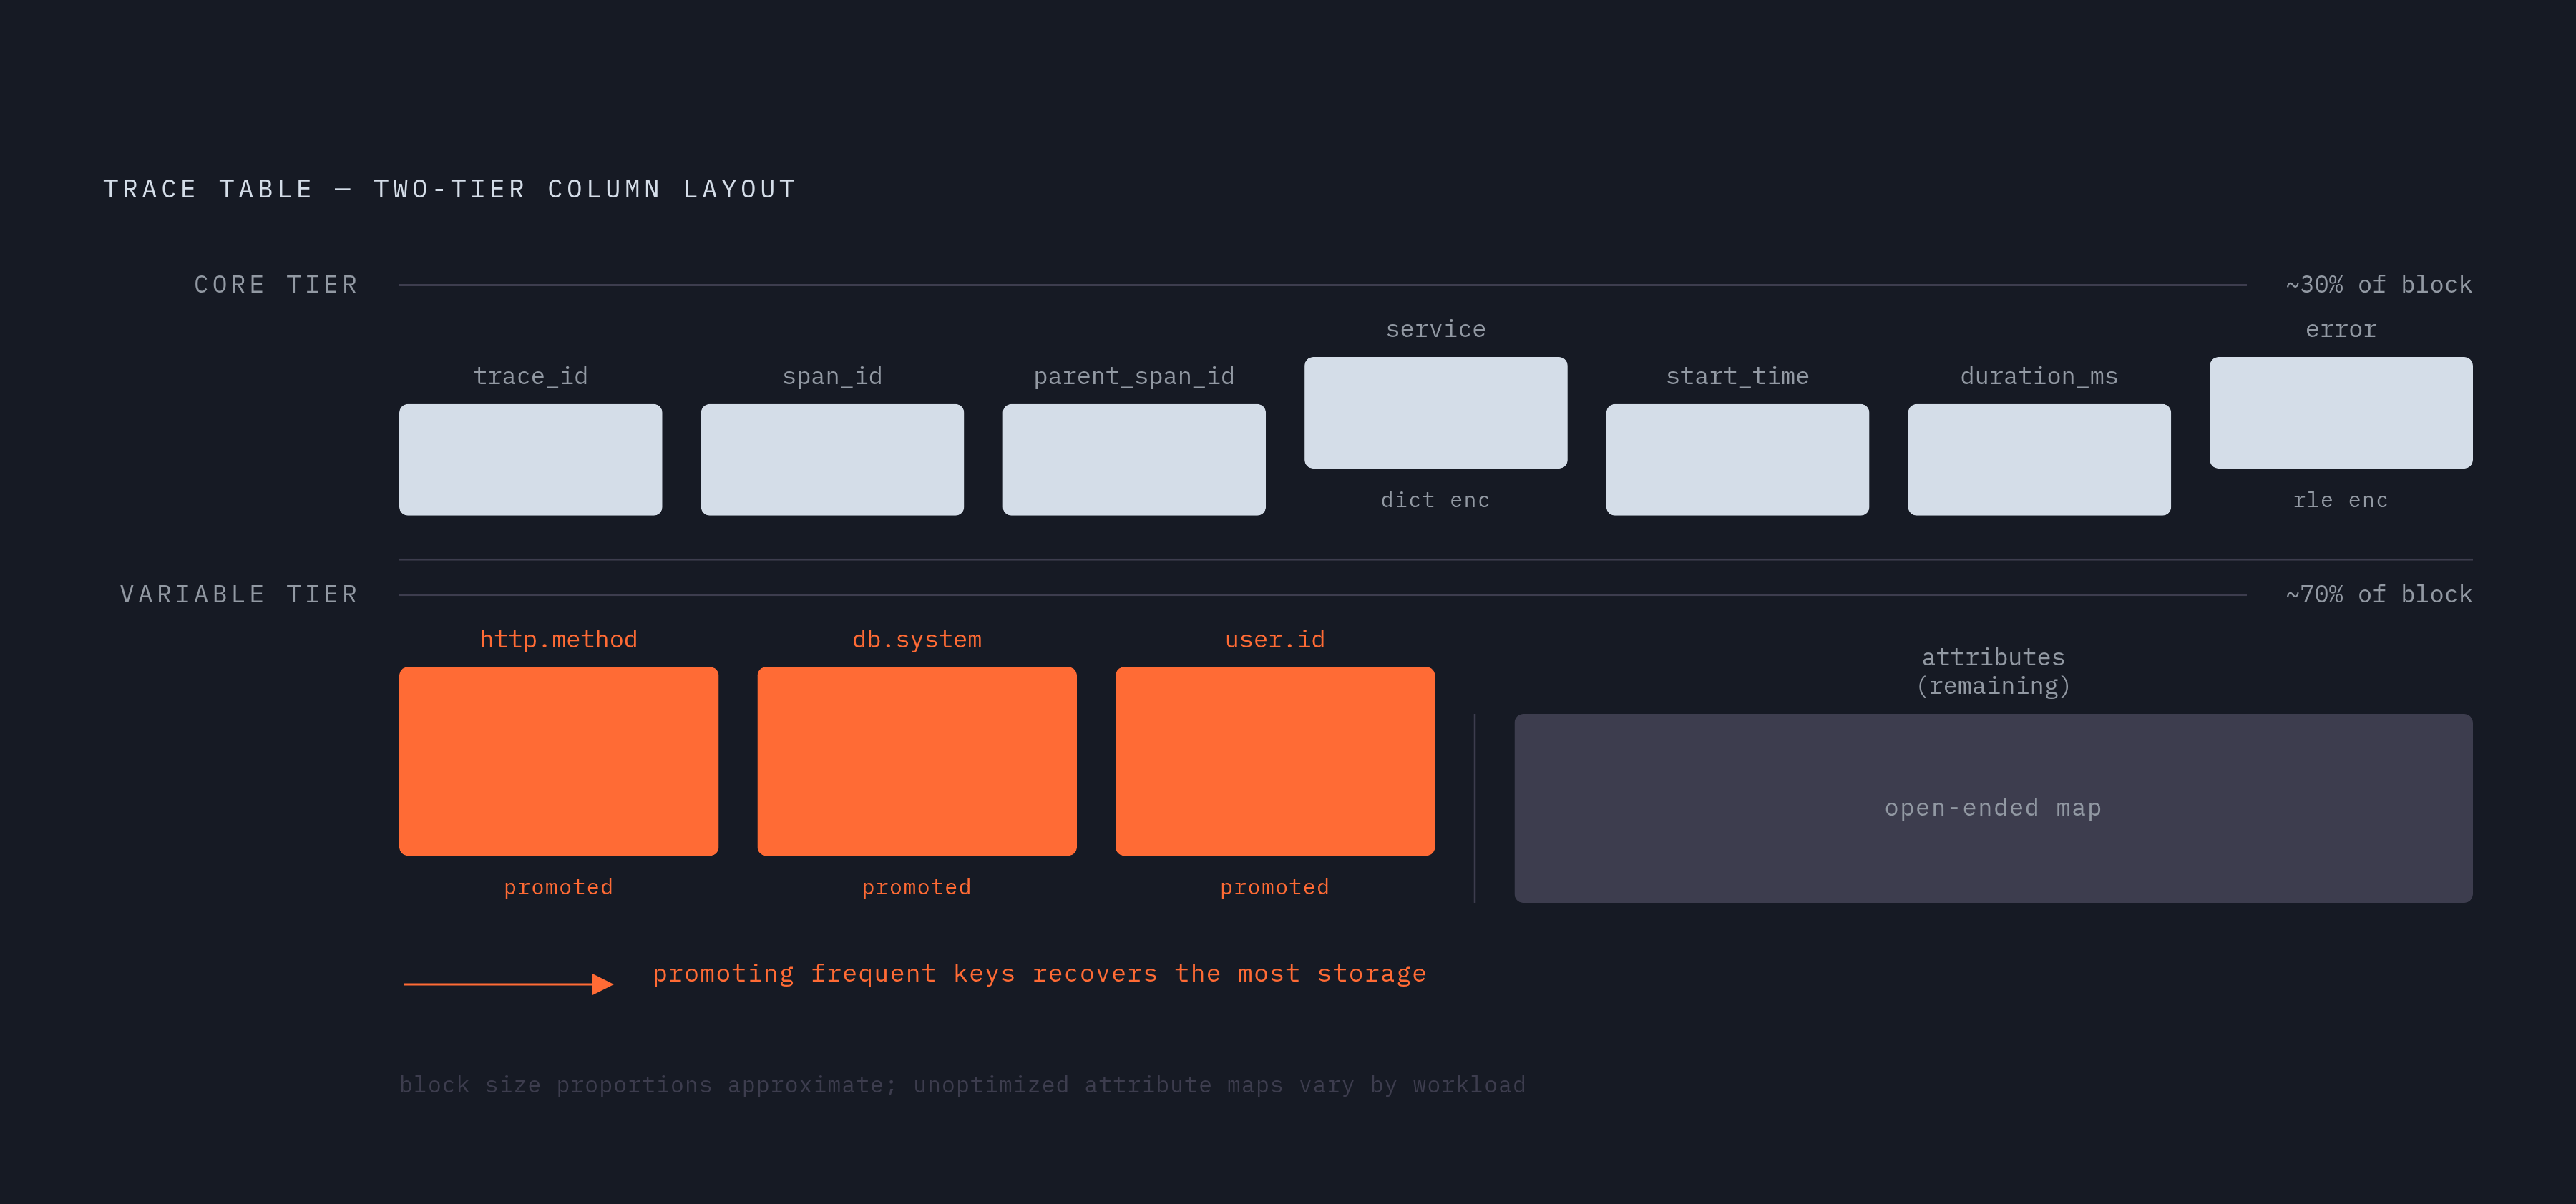
Fixed fields including trace_id, span_id, parent_span_id, service, start_time, duration_ms, and error form the stable core of a trace table. They support trace reconstruction and common filters, so burying them inside generic attribute structures works against the expected queries. Fields such as duration_ms and error are storage representations rather than a replacement for OpenTelemetry’s timestamps and status. The schema translates the model into a useful query layout.
Attributes require a different choice because an open-ended set of keys cannot sensibly become an open-ended set of columns. A map or encoded column structure holds the variable remainder without making the table endlessly wider. A small set of frequently used keys accounts for much of the attribute data, so selectively promoting those keys into dedicated columns improves filtering without schema explosion.
Identifiers belong at the span level because repeating them for every attribute row stores pointers instead of new diagnostic information and can consume a substantial share of storage. Columnar layouts can compress repeated values through dictionary encoding on service and run-length encoding on error. They also let queries read just the columns they need without reading the whole span payload in each scan. These benefits depend on the column layout within the engine.
Finally, time partitioning lets queries skip entire partitions outside the requested day or hour. Since trace investigations usually look at recent windows, this pruning keeps older data from making every scan larger. SigNoz’s primary trace table, distributed_signoz_index_v3, provides a concrete production example. It stores spans in a columnar engine with columns optimized for filtering common attributes, following OpenTelemetry Trace Semantic Conventions.
What schema redesign actually recovers in storage and query cost
The cost of a poor layout compounds with every incoming span. If trace IDs and span IDs are written once per attribute row, adding context also adds repeated structural overhead. In an attribute-centric layout, that overhead can consume the majority of storage. A generic attribute index creates a related imbalance when it occupies most of a storage family but serves only a small share of searches.
Removing identifier repetition and replacing generic indexing with selective column promotion can recover a substantial fraction of per-span storage. At high span volumes, that can translate into terabytes recovered per day across a week-long retention window. Each redundant identifier and little-used index entry is multiplied by the stream. Redesign removes the recurring cost that further compression would only reduce.
Filtering by status.code and service.name can read those columns without scanning the attributes and events attached to each span. Retrieving the matching spans may require more fields, but the filter need not read everything first. Designing for these query patterns from the start avoids an expensive and disruptive retrofit later.
The trade-off between columnar databases and object storage as trace backends
A sound column layout still leaves an architectural question. Where should those columns live when someone needs to query them? A hot columnar OLAP database keeps data on fast local or NVMe-backed storage and serves queries from memory or locally cached columns. That keeps p99 latency low, but costs more at high volume and makes the system harder to run as it grows. SigNoz takes this columnar OLAP path.
Grafana Tempo instead stores trace data in object storage. Grafana’s Tempo architecture documentation describes how span resources and attributes are sorted into an Apache Parquet schema before they are sent to object storage to be kept long term. Parquet still permits queries to read only the columns they need, so object storage does not mean abandoning columnar access. An uncached read pays object store GET latency.
That round-trip creates a latency floor that an index or query rewrite cannot remove. Whether it is acceptable depends on whether the system primarily supports archival investigation or real-time product queries. Neither architecture is universally correct. A fast local cache using NVMe or memory can combine hot-query performance with object storage durability, but only when the cache is a first-class architectural component. A thin cache does not remove the underlying trade-off for queries it cannot serve.
Why sampling strategy is a schema and storage decision, not just an ingestion knob
Sampling changes not only how much data is stored, but what the retained records can say. Head-based sampling decides at the start of a trace whether to record it. That is simple, but it can discard a request that begins normally and later ends in an error. Tail-based sampling waits until the full trace is assembled before making the decision, allowing anomalous traces to be retained. The cost moves into buffering complete traces before keeping or dropping them.
Span-level sampling asks a different question. Can spans that tell little be removed while keeping what the trace reveals about a problem? Autoscope’s span-level sampling research finds that most spans tell little that helps diagnose performance issues, while a small fraction are key to finding the cause. Removing spans this way can thus keep more useful evidence per stored byte than dropping whole traces. It also creates a harder structural obligation.
A retained child may have a parent_span_id that points to a span no longer stored, leaving a partial causal chain whose missing parent may reflect an intentional omission. The schema must support partial traces, and query tools must handle missing parents gracefully. Sampling and reconstruction therefore need to be considered together, because reducing volume is not enough if the resulting hierarchy misleads the investigation.
How AI agents query trace data differently and what that demands from the schema
Human investigators usually work through traces sequentially. An engineer opens a trace, follows its parent-child chain, inspects a span, and checks its attributes. An AI agent may instead look through services, time ranges, and attribute values by running many queries at once. The same span table then serves a workload closer to a batch analytical job than a short interactive session. A schema designed around a few targeted reads must also support this broader, parallel access.
That difference reaches beyond query speed. Per-query pricing makes the number of questions a direct cost driver, even when each question is efficient. Compute-capacity pricing removes that particular penalty, although the work still consumes compute.
Autonomous access also requires a queryable record of the interaction. That record must capture who initiated it, what query was generated, when it ran, what it returned, and whether it encountered errors. This requires a separate schema beyond the span fields themselves. Isolated, read-only compute lets agents search shared trace history without giving them permission to change production data.
What "good" trace storage looks like when schema, architecture, and access pattern are aligned
The decisive test is whether the layers reinforce each other. Selective columns and time partitions reduce the data a query needs, while a first-class hot cache keeps that reduced working set close to compute. Object storage can then provide durability without setting the latency of hot trace queries. This arrangement makes the schema’s selectivity useful at the architectural level.
Sampling determines which causal evidence remains, so reconstruction must respect the limits of the stored hierarchy. Agent access broadens the questions asked of that evidence, so read-only isolation and query logging must accompany the extra compute. Compute-hour pricing then matches the capacity consumed.
The predictable failure is a mismatch between layers. A fast backend cannot restore discarded causal evidence, and a careful schema cannot erase an unavoidable remote read. Knowing the span structure helps teams see those limits before they cause problems in running the system. A team that understands it deeply can make better storage decisions faster, because it knows what the system must preserve, what it can compress, and what each query actually needs.