P99 Latency Stability at Growing Data Volumes in Managed OLAP Databases
Managed OLAP databases face predictable P99 latency cliffs as data volumes grow.
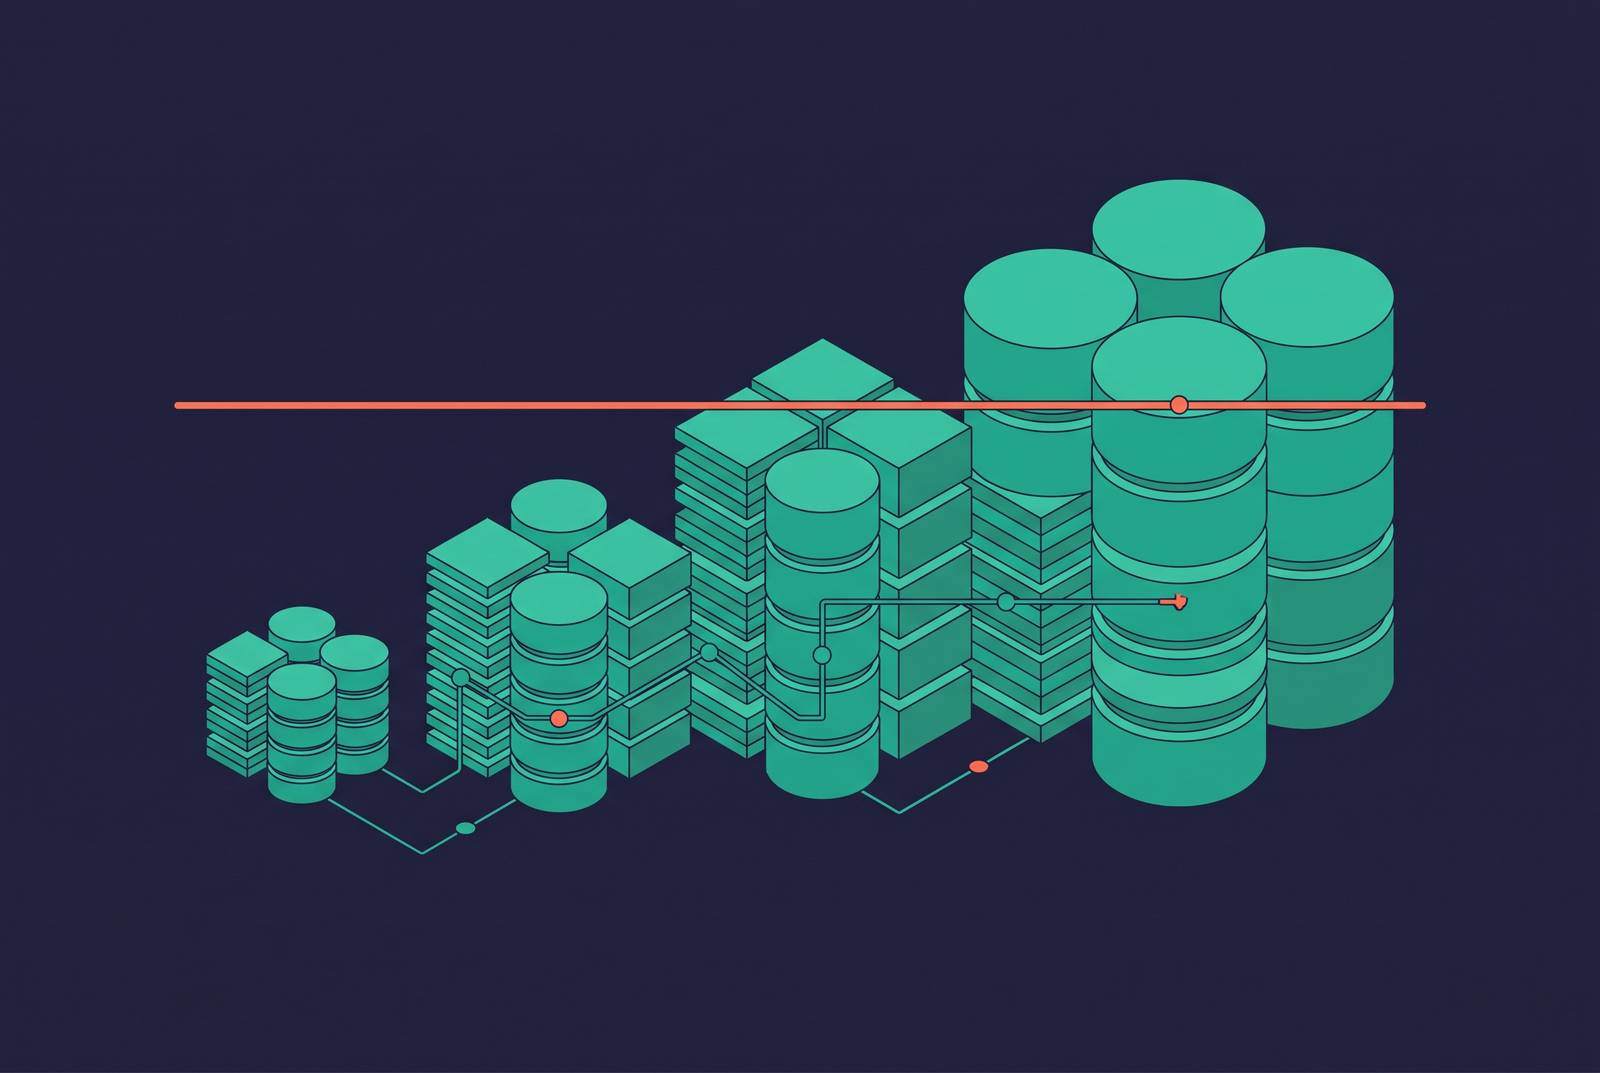
P99 latency is the number that tells you whether your analytics are still interactive. In OLAP systems, a single query fans out across many shards, and the coordinator waits for every one of them to finish. The slowest shard becomes the response time every user feels.
Why P99 latency is the wrong metric to ignore in OLAP systems
Mean and median hide the worst-case user experience. P99 surfaces it directly. It is the latency value below which 99% of requests complete, and in OLAP it is the metric that decides whether interactive analytics stay interactive.
Interactive analytics run on tight targets. Sub-second response for filtering is the baseline. Around 300 to 500ms is what "feels instant" to a person clicking a dashboard. Those targets demand consistency, not a low average with frequent spikes.
A stable P99 beats a low mean with outliers every time. The reason is structural. In OLAP, a query fans out across many shards, and the coordinator waits for all of them. Effective response time is set by the slowest shard, not the average one.
Why does this matter as volumes grow? Because at high query-per-second rates, 1% of slow requests is not a rounding error. The pattern looks random, but it has identifiable structural causes. The sections ahead name and explain them.
How scatter-gather amplification makes P99 worse as shard count grows
Scatter-gather execution is why P99 degrades predictably as data volumes, and shard counts, grow. In a distributed OLAP system, the broker dispatches sub-queries to all relevant servers in parallel. Then it waits for every result before assembling the response.
Brokers pick target servers from routing tables, send sub-queries in parallel, and combine partial results. The final latency is bounded by the slowest participating server.
That is the amplification mechanism in one line. As shard count grows, the probability that at least one shard is slow on any given query goes up. It is a combinatorial effect, not a configuration problem.
A system that holds P99 at low shard counts will see it rise as it scales. Unless, of course, it has a way to route around slow nodes or bound their contribution. Static replica selection does not eliminate the compounding-probability effect.
What works instead is a routing layer that reads real-time performance signals and picks among replicas. LinkedIn's Adaptive Server Selection, or ADSS, is the production-proven model. It then ramped back without manual intervention. That class of resiliency issue was largely eliminated.
Beyond static replica selection, there is another design choice that reduces the problem at the source. A cache-mesh architecture like ObsessionDB's keeps hot data in memory across a distributed layer, so fewer shards need to be queried on any given request. Lower fan-out means lower combinatorial probability that any single slow node becomes the bottleneck.
How hot-data eviction turns cache pressure into P99 spikes
If hot data no longer fits in memory, queries get evicted onto slower storage paths. P99 spikes in a pattern that looks random but is structurally predictable. The key is that OLAP query patterns are not uniform.
A small portion of the dataset receives the vast majority of queries. As total data volume grows, memory has to hold a smaller share of the hot data. Eviction pressure mounts, and previously cached data must be fetched from storage on every query.
The result is not a smooth latency increase. It is a cliff. Queries that were sub-second when data fit in cache become multi-second when they cannot, with no change to the query itself.
This is why cache policy is a direct lever on tail behavior, not just throughput. That is the right framing. Cache design is a tail-latency decision.
A cache architecture that keeps hot data in NVMe or memory contains this cause. One that routes every query through object storage converts every eviction event into a storage-layer round-trip. The cliff gets steeper. Architectures that route every query through object storage turn a brief eviction spike into a compounded latency problem.
Why routing queries through object storage turns latency degradation into a structural constant
Object storage is not built for OLAP tail-latency budgets. It is built for durability and cost. The sub-millisecond random-read access that interactive analytics require is not what S3 and its equivalents do best.
Managed OLAP architectures that separate compute from storage often route live query traffic directly through that storage layer. They do it for cost reasons. But then they get object-storage latency on every cache miss.
Mitigations exist. They also add implementation complexity, and they are not uniformly available across managed offerings. The architectural mismatch does not go away.
The correct separation is this: object storage handles durability and cold data, where latency tolerance is high. A local or NVMe cache layer handles the hot path, where you can't tolerate much latency. Routing live queries through S3 collapses that separation.
The architectural alternative is simple to state. Keep the working set in a local cache mesh, and do not let production reads touch object storage. Managed services that do this turn a structural constant into a bounded variable. ObsessionDB was designed around exactly this split: S3 for durability, NVMe cache mesh for speed, hot data in memory, queries never touching S3. That is the position that prevents this cause from becoming structural.
How compaction debt and background work accumulate silently into a latency cliff
MergeTree compaction debt, background pool misconfiguration, and accumulating small files are a form of operational entropy. They turn manageable P99 drift into a sudden latency cliff. OLAP engines that use merge-tree storage accumulate parts as data is ingested. Background compaction is supposed to consolidate them. If compaction is under-resourced or misconfigured, parts pile up.
Read performance degrades non-linearly as part counts grow. Each query has to inspect more parts, which adds I/O and CPU overhead. The failure pattern will be familiar to anyone who has operated a large system: queries that ran in milliseconds three months ago now run in seconds, with no apparent triggering event.
PingCAP's TiDB 8.5 engineering work documents this class of problem directly. Tail latency was dominated not by the common case but by rare, catastrophic stalls: GC pauses, lock contention, storage snapshot overhead. These are low-frequency, high-impact background events that manifest as P99 and P999 spikes.
The fix was to target root causes of variance, not averages. An upgrade from v7.5.6 to v8.5.4 on the same workload and configuration produced a step-change. The lesson for OLAP is direct: background work is not a tuning afterthought. It is a first-class contributor to P99 behavior.
At petabyte scale, the steady state is an illusion.
How the four causes compound as data volume grows
The four causes do not add linearly. They amplify each other. Scatter-gather amplification, hot-data eviction, storage-layer round-trips, and compaction debt interact in ways that make P99 instability at scale qualitatively worse than at small volumes.
Take the interaction between compaction debt and scatter-gather. Compaction debt raises part counts, which raises per-shard query cost, which raises the probability that at least one shard in a fan-out is slow. The two causes multiply.
Now add hot-data eviction. Eviction forces queries onto the storage layer. If that layer is object storage, each eviction turns into a round-trip with object-storage latency. Two more causes multiply.
Operational entropy lands on top. At low volume, these are small perturbations. At high volume, with already-degraded base latency, they become large spikes.
The resiliency framework is explicitly layered: workload isolation, zone-aware placement, and adaptive routing are three separate defenses because no single one is sufficient. Each cause operates below a threshold. When data volume pushes several causes past their thresholds at the same time, P99 jumps discontinuously.
The implication should be clear. Containment requires addressing all four causes at design time, not as post-hoc optimizations. Systems that treat P99 stability as a tuning problem rather than an architectural property will encounter the same cliffs at larger scale.
What architectural decisions at design time determine whether the causes are containable
The decisions that contain P99 instability are made before the first query runs. Cache layer placement, routing intelligence, workload isolation, and background-work visibility are containment choices, not tuning knobs. Cache layer placement comes first. Hot data must live in memory or NVMe. The query path can't require a round-trip to object storage for data that is actively queried. The design specifically prevents query paths from touching S3.
Adaptive routing intelligence is next. Static replica selection is not enough. The routing layer has to watch real-time server performance and route around degraded nodes. Performance-signal-driven routing detects fail-slow nodes and reroutes traffic dynamically.
Workload isolation matters for the same reason. Mixed workloads on shared compute cause noisy-neighbor interference. Isolation must be enforced at the resource-budget level, not just the query-priority level. It delivers predictable tail latencies for multi-tenant mixed workloads with under 1% overhead.
Background-work visibility and control are the last piece. Compaction scheduling, merge-pool sizing, and background task prioritization must be first-class operational controls. Systems that expose these controls and surface compaction debt before it becomes a cliff give operators the ability to intervene. Systems that abstract them away get short-term simplicity but long-term P99 instability.
Zone-aware data placement deserves its own mention.
These decisions compound, in the same way the failure causes do. Get all of them right and containment is achievable. Miss one and the others are undermined.
How pre-aggregation and schema design give operators a query-level defense against P99 drift
Pre-aggregation and schema design are the query-level complement to architectural containment. They reduce the computational work a query must do, bounding the per-shard cost that feeds scatter-gather amplification. The AggregatingMergeTree plus materialized-view pattern converts full-scan P99 computation into a cheap merge at query time. Aggregate state is stored at insert time using -State functions. Queries use -Merge combinators to reassemble results without re-scanning raw data.
Aggregate projections can embed quantile state directly inside the MergeTree, using something like quantileTDigestState. Queries must use -Merge combinators such as quantileTDigestMerge to read the pre-computed state. So application SQL does need to change if you want quantile-state projections to help. It is a transparent performance defense, but it is not free.
Why does this pattern matter for P99 specifically? Because it bounds the worst-case per-shard cost. A query that would otherwise scan hundreds of gigabytes of raw data can read a pre-computed aggregate instead. Both the mean and the variance of shard execution time drop. And when every shard completes in a narrow, bounded window, the probability that one shard becomes the long tail of the fan-out falls significantly.
One might object that pre-aggregation limits query flexibility. The answer is that it is a targeted defense for high-cardinality, high-frequency dashboard queries where P99 is the primary concern. Raw tables remain available for exploratory queries where latency tolerance is higher. ObsessionDB's CHKit gives agents structured commands to describe, validate, and deploy schema and pipelines as code. Pre-aggregation patterns become a reproducible, auditable part of the deployment process rather than a one-off DBA exercise.
What production deployments at scale reveal about which defenses actually hold
Production deployments at extreme scale validate the layered-defense model. No single mechanism is sufficient. The teams that hold P99 stable are the ones that implemented containment at every layer simultaneously.
The system runs at hundreds of thousands of queries per second across 5,000+ server hosts and 1,400+ broker hosts. It serves hundreds of TB to petabyte-scale datasets with sub-second P99 SLAs for site-facing cases such as Who-Viewed-My-Profile, Advertiser and Creator Analytics, and Talent Insights. The resiliency framework, QWI, ADSS, and Zone-Aware Placement, was built because at that scale operational entropy is constant. The question is not whether failures occur but whether the system absorbs them without SLA violations.
When their dataset doubled, a cluster of more than 1,000 nodes hit vertical scaling limits. They separated the data plane from the control plane entirely, and they hit a strict 50ms P999 at 1.6 billion feature retrievals per second.
PingCAP's TiDB 8.5 production upgrade demonstrates the same principle from another angle. Eliminating variance sources, not improving averages, produced the largest tail gains. Targeting GC pauses, lock contention, and storage snapshot overhead produced a step-change in P999 on the same workload and configuration.
The common thread across all three cases is clear. P99 stability at scale requires identifying and eliminating sources of latency variance, not optimizing the common case. The systems that held their SLAs did so by making the worst case bounded, not by making the average faster.
For teams evaluating managed OLAP options, that changes the evaluation question. It is not "what is the median latency on a benchmark workload." It is "what happens to P99 when data volume doubles, shard count grows, and a zone goes into maintenance all at once." The architecture that matters is the one that holds under the conditions that actually cause P99 drift.